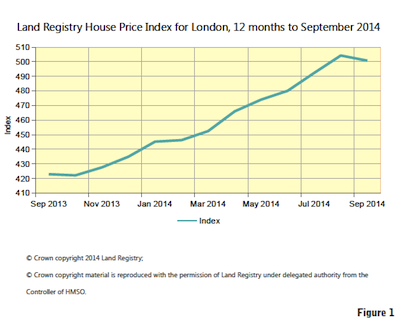
London House Prices – According to the Land Registry’s House Price Index (HPI) for September 2014, which captures actual changes in the value of residential properties, the average price of property in England and Wales has increased by 7.2% in the last 12 months. The region which experienced the most significant movement in its average property value over the same period is London, with an increase of 18.4% (see figure 1). However, on a monthly basis, London property prices saw a 0.7% decline between August and September 2014.
 London Boroughs – The two London boroughs with the highest average house prices remain Kensington and Chelsea, and City of Westminster. The 12 month increases to September 2014 in these boroughs were 15.2% and 17.1% respectively. However, some of the London boroughs with the highest annual increases in average prices, for the same period, were Lambeth (Nine Elms), Southwark, Hammersmith and Fulham, Wandsworth, and Islington, which also had the second highest monthly increase in September at 2.3%. This shows a tendency of investors to move to more up and coming areas. The annual increases to September 2014 in the above boroughs were 28.6%, 26.0%, 24.6%, 23.9%, and 23.4% respectively.
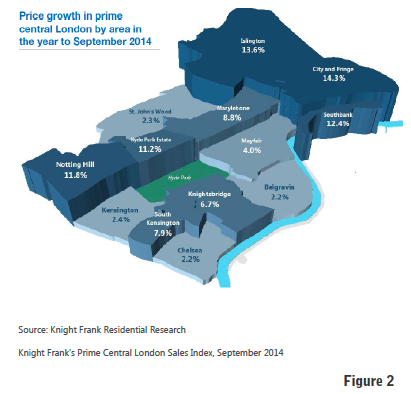 Prime Central London Prices – While we are finally seeing a slowdown in price growth, according to Knight Frank, the annual growth rate in prime central London (PCL) prices is still higher than it was a year ago, with an increase of 7.4% in the 12 months to September 2014, compared to 7.2% in the 12 months to September 2013. City and fringe, and Islington were the areas with the highest growth in value (see figure 2). PCL prices increased 1.0% over the third quarter of 2014, compared to 2.3% during the second quarter. The rate of monthly price increases finally fell to 0.3% in both July and August, after rising to 0.8% in March and continuing at that rate of growth consistently until June. In September the monthly increase in prices was heading back up at 0.4%, putting growth back to January 2014 levels.
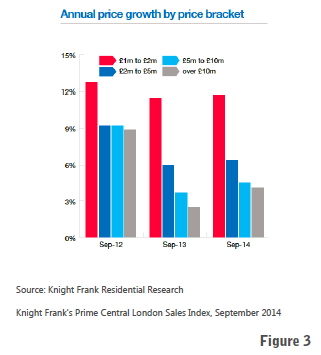 Property Price Brackets – According to the Land Registry data, the number of £1m+ properties sold in London in July 2014, increased by 17% on last year’s figures and £2m+ property sales increased by 23%. Knight Frank’s data shows the annual growth in average prices for these PCL properties remains positive (see figure 3). The most significant increase on the previous year’s figures was seen in the super-prime bracket, where the £10m+ properties experienced annual growth rates in value of around 4% in September 2014, a marked jump up from the previous year when growth was under 3%. In the £5m to £10m property bracket annual price growth in this period was slightly higher at around 4.5%, while for properties between £2m and £5m it was about 6.5%. The lower end of the prime market, properties valued at £1m to £2m, grew at the highest rate – around 12% in the year to September 2014.
Current Price Sentiment – Knight Frank’s House Price Sentiment Index (HPSI), which measures UK households’ perceptions of current and future property values, saw the current HPSI value decline for the fourth consecutive month since its record high in May 2014 (see figure 4). However, for the 18th consecutive month the sentiment was that property values have continued to rise. Households across all 11 regions surveyed expressed a perception that their property values had risen in September, but at the slowest rate since January 2014. As always, perceptions of current price rises were strongest in London, although these were lower than they had been at their peak in May.
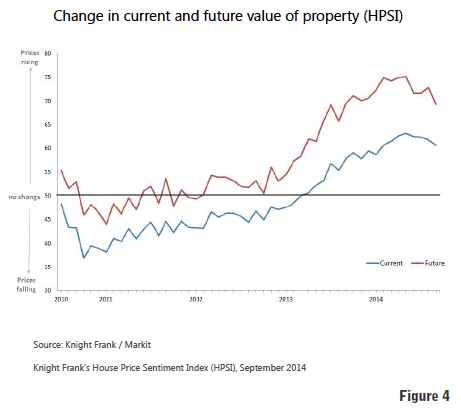
Future Price Sentiment – The future HPSI for the UK fell to its lowest value in just over 12 months, after peaking in May 2014 (see figure 4). Future expectations for London also fell again this September, after peaking in April. In the last three months the South East has outranked London in terms of the strength of these future expectations. However, expectations for price rises in London still remain well above the index base rate and have more often than not topped the charts over the last 12 months. Overall expectations are property prices will continue to rise further in 2014, but the rate of growth will continue to diminish to more moderate levels. This remains a positive sign as the market continues to stabilise.
International Buyers – A significant percentage of PCL property buyers remain foreign. Albeit to a lesser extent, investment is still being driven both by international investors looking to escape economic and political instability in their own countries and by high-net-worth-individuals (HNWIs) simply looking to diversify their excess wealth. In the first half of the year we began to see a greater influx of Europeans from countries whose economies have been struggling to recover and who see London as a safe place to weather the economic storm. According to Knight Frank, Italians made up 6% of the foreign buyers in London, the French were the second largest group at 4.1%, and the Russians, in third place at 3.8%, still maintain a significant presence in the prime central London property market.
- Land Registry House Price Index, September 2014 – © Crown copyright 2014 Land Registry. © Crown copyright material is reproduced with the permission of Land Registry under delegated authority from the Controller of HMSO;
- Knight Frank’s Prime Central London Sales Index, August 2014 and September 2014;
- Knight Frank’s House Price Sentiment Index (HPSI), September 2014.
Past issues
- Spring 2014
- Summer 2014
- Autumn 2014
- Winter 2015
- Spring 2015
- Autumn 2015
- Winter 2016
- Spring 2016
- Summer 2016
- Autumn 2016
- Winter 2017
- Spring 2017
- Summer 2017
- Autumn 2017
- Winter 2018
- Spring 2018
- Summer 2018
- Autumn 2018
- Winter 2019
- Spring 2019
- Summer 2019
- Autumn 2019
- Winter 2020
- Summer 2020
- Autumn 2022
- Winter 2023
- Spring 2023