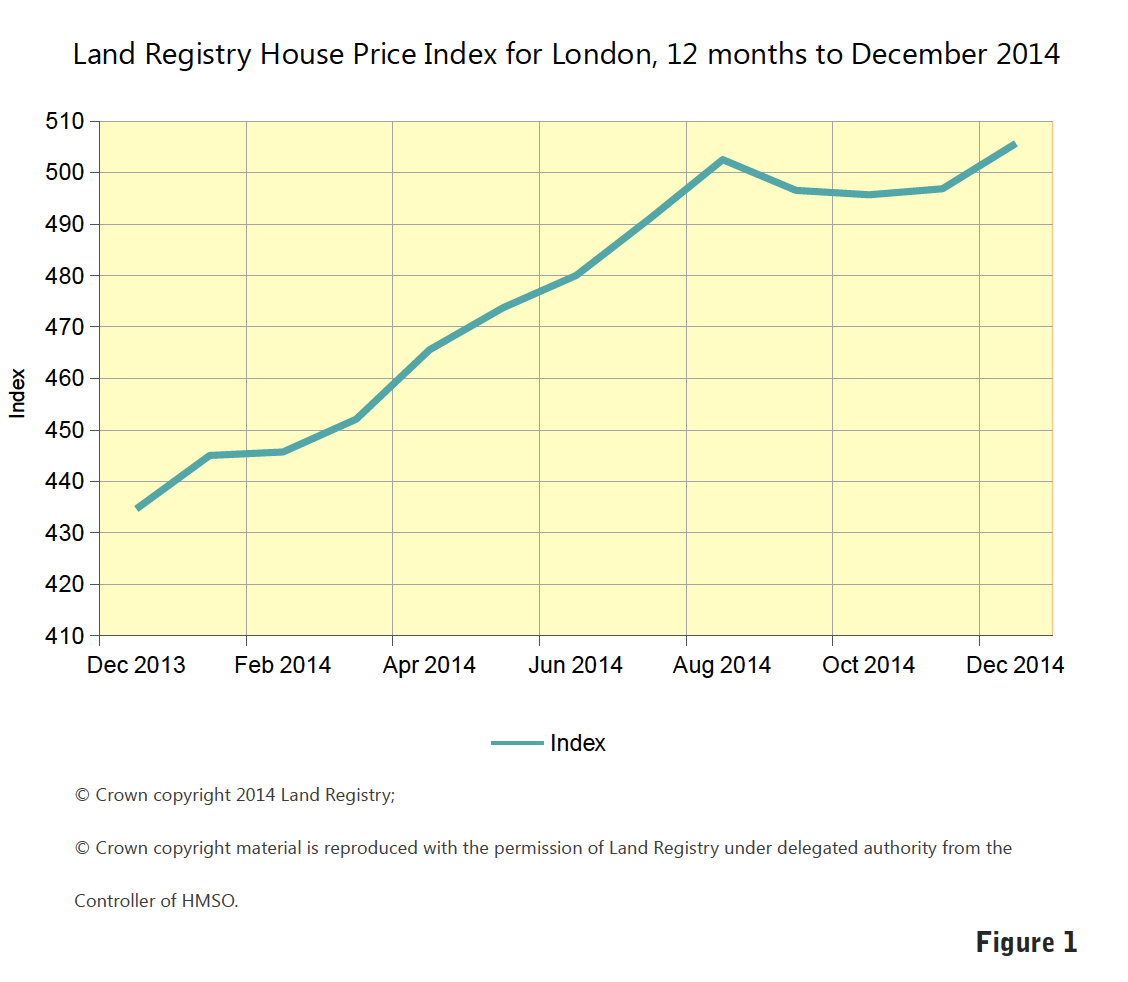
London House Prices – According to the Land Registry’s House Price Index (HPI) for December 2014, which captures actual changes in the value of residential properties, the average price of property in England and Wales increased by 7.0% in the 12 months to December 2014. The region which experienced the most significant movement by far in its average property value over the same period is London, with an increase of 16.3% (see figure 1). On a monthly basis, London property prices saw a 1.8% increase between November and December 2014, making it the region with the highest monthly increase.
 London Boroughs – While the two London boroughs with the highest average house prices remain Kensington and Chelsea, and City of Westminster, the 12 month increases to December 2014 in these boroughs were amongst the lowest at 11.5% and 14.2% respectively. These two boroughs did not fair so well on a monthly basis either, declining 0.6% each between November and December 2014. Southwark and Lambeth (Nine Elms) still remain amongst the London boroughs with the highest annual increases in average prices, for the same period. The annual increases to December 2014 in the these boroughs were 23.8% and 23.3% respectively. This supports our view of a growing tendency amongst buyers to place less importance on purchasing properties in the more conventional areas and more importance on the specifications of the property and the amenities of the building. This has led to an increase in purchases of new-builds and a shift towards areas that are less prime, but where redevelopment has been taking place over the last few years. Similarly, there are other areas that have been earmarked by developers where there are a number of upcoming new-build schemes that could possibly outperform prime central London (PCL) in the coming years.
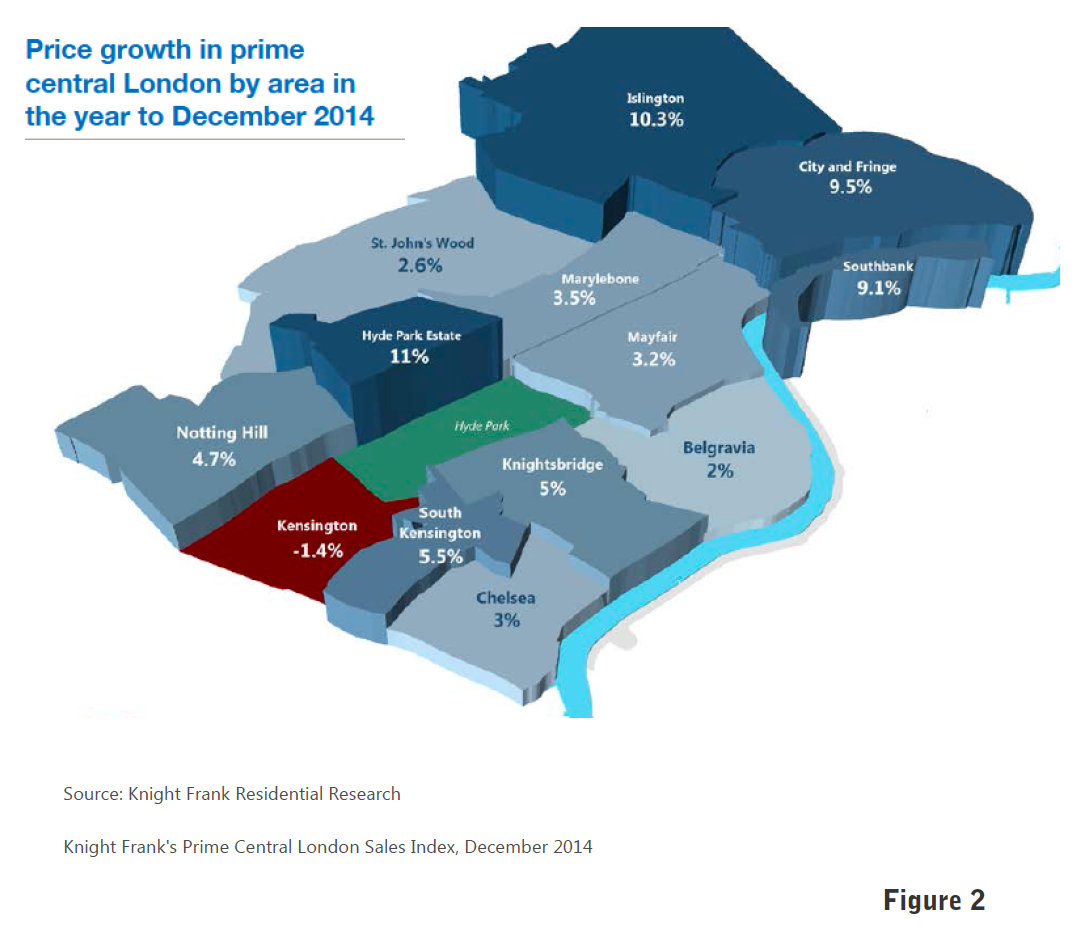 Prime Central London Prices – An increase in the annual growth rate in PCL prices of only 5.1% in the 12 months to December 2014, compared to 7.7% in the 12 months to December 2013, puts price growth at its lowest level for five years. However, while we are now clearly seeing a slowdown in growth, according to Knight Frank, prices have still risen an impressive 52% in this same five year period. As prices in PCL areas like Mayfair have climbed steeply over the last years, buyers have now started to invest in the surrounding areas. The result being these surrounding areas are beginning to see their prices climb quite sharply. In 2013, Marylebone saw double-digit growth, which subsequently eased to 3.5% in 2014, and Hyde Park Estate took over with an annual growth of 12.9%, the highest in prime central London in 2014. City and Fringe, and Islington still remain amongst the top three areas experiencing the highest growths in values (see figure 2).PCL prices declined -0.3% over the fourth quarter of 2014, compared to an increase of 1.0% during the third quarter. The rate of monthly price increases finally stopped in October 2014, and then declined slightly the following month. In December 2014, the decline in monthly price growth eased to only -0.1%, from a decline of -0.2% the previous month.
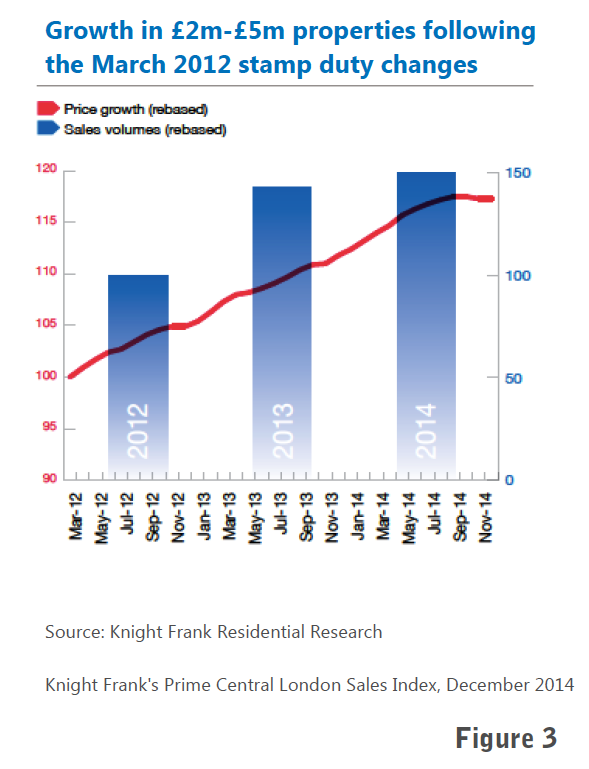 Property Price Brackets – According to the Land Registry data, the number of £1 million+ properties sold in London in October 2014, increased by 4% on last year’s figures, while £2 million+ property sales increased by 5%. Knight Frank’s data shows, although it is still too early to have a clear picture, the market seems for the most part to be reacting sensibly to the increase in stamp duty introduced in December 2014, for properties valued at over £937,500, just as they did to the rise in stamp duty for £2 million+ properties from 5% to 7% in March 2012. Regardless of the fearmongering following that rise, prices for properties between £2 million and £5 million have actually grown 17% since then (see figure 3). However, the most significant increases have been seen in the super-prime £10 million+ bracket. In terms of volume growth, the number of £10 million+ properties sold in the first 10 months of 2014 were over 30% higher than they had been in the same period the previous year and over 90% higher than in 2012, when the stamp duty increases were introduced. In terms of value growth, prices of these super-prime properties have risen nearly 50% in almost six years, but have since levelled off to single-digit rises. In the 12 months to October 2014, growth stood at a more moderate 3.3%.
Current Price Sentiment – Knight Frank’s House Price Sentiment Index (HPSI), which measures UK households’ perceptions of current and future property values, saw the current HPSI value rise slightly in December 2014, after declining gradually for most of the latter half of the year, following its record high in May 2014 (see figure 4). However, for the 21st consecutive month the sentiment remains property values have continued to rise. Households across all 11 regions surveyed expressed a perception their property values had risen in December, with the index rising above the lowest values for the year seen in January and November 2014. As always, perceptions of current price rises were amongst the strongest in London.
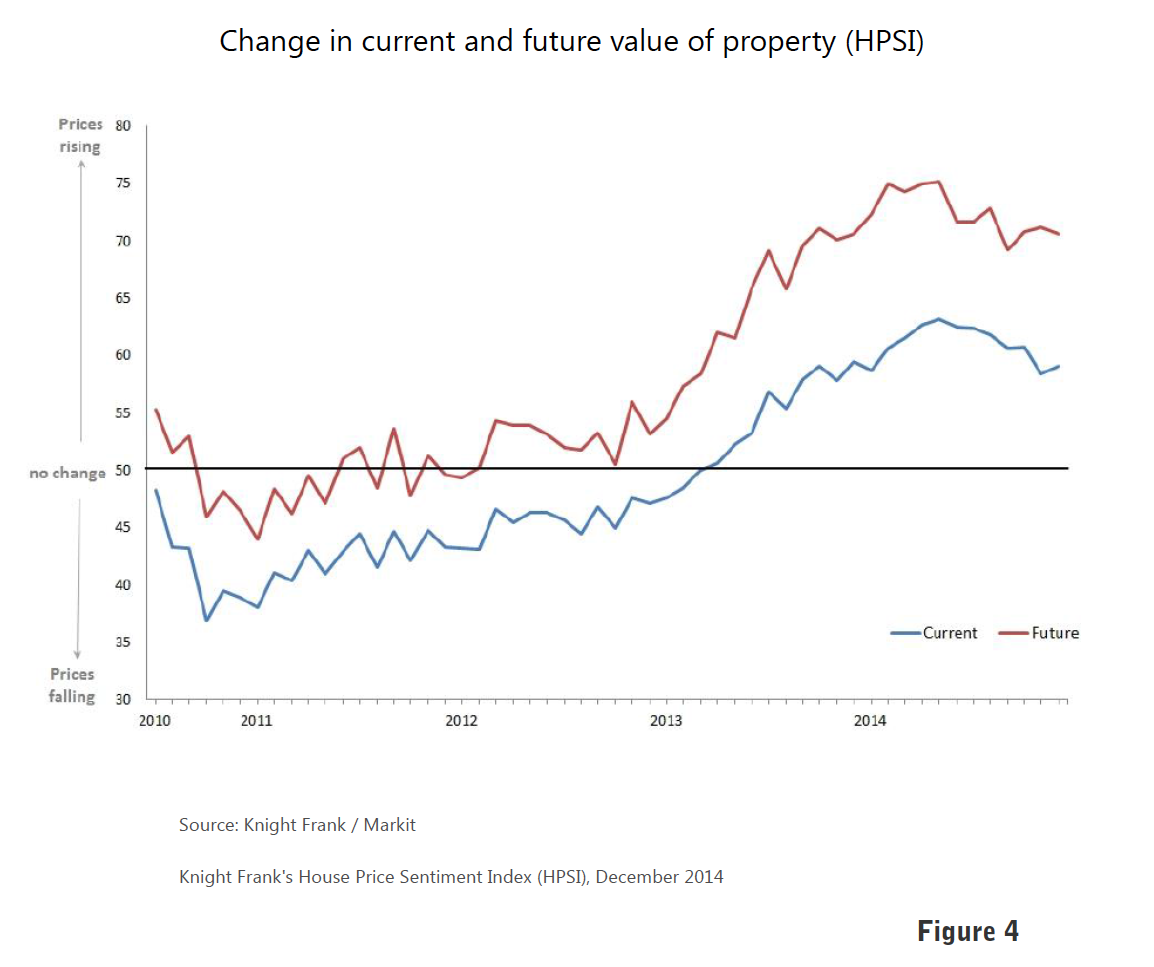
Future Price Sentiment – The future HPSI for the UK fell to its second lowest value in 16 months, after peaking in May 2014 (see figure 4). Future expectations for London also fell in December 2014, following some ups and downs after their peak in April. For the majority of the last six months the South East has outranked London in terms of the strength of these future expectations. However, expectations for price rises in London still remain well above the index base rate and have consistently ranked in the top three. Overall expectations are property prices will continue to rise further in 2015, but at the diminishing rate of growth the market experienced over the second half of 2014. On a positive note, in December 2014, the percentage of UK households intending to purchase a property during 2015 was up from November’s figures.
International Buyers – A significant percentage of PCL property buyers remain foreign. Although the upcoming UK general election will mean some buyers will be inclined to exercise caution, investment in London will continue to remain significantly driven by international investors looking to escape economic and political instability in their own countries. In the first half of 2014 we began to see a greater influx of Europeans from countries whose economies had been struggling to recover and who saw London as a safe place to weather the economic storm. According to Knight Frank, Italians made up 6% of the foreign buyers in London, the French were the second largest group at 4.1%, and the Russians were in third place at 3.8%. However, following a time of uncertainty, the Russians appear to be resurfacing as key players in the PCL market. Between April and October 2014, 21% of super-prime properties sold were purchased by Russians, compared to only 13% between October 2013 and April 2014. The Chinese are also emerging as players in the super-prime market, accounting for 3% of sales, mainly houses, in 2014. Previously, the Chinese ultra high net worth individuals (UHNWIs) were happy to test the waters with properties below the £1m mark, often flats, but a weakening economy back home and the growth and expansion of Chinese companies globally appears to be stimulating demand (see figure 5).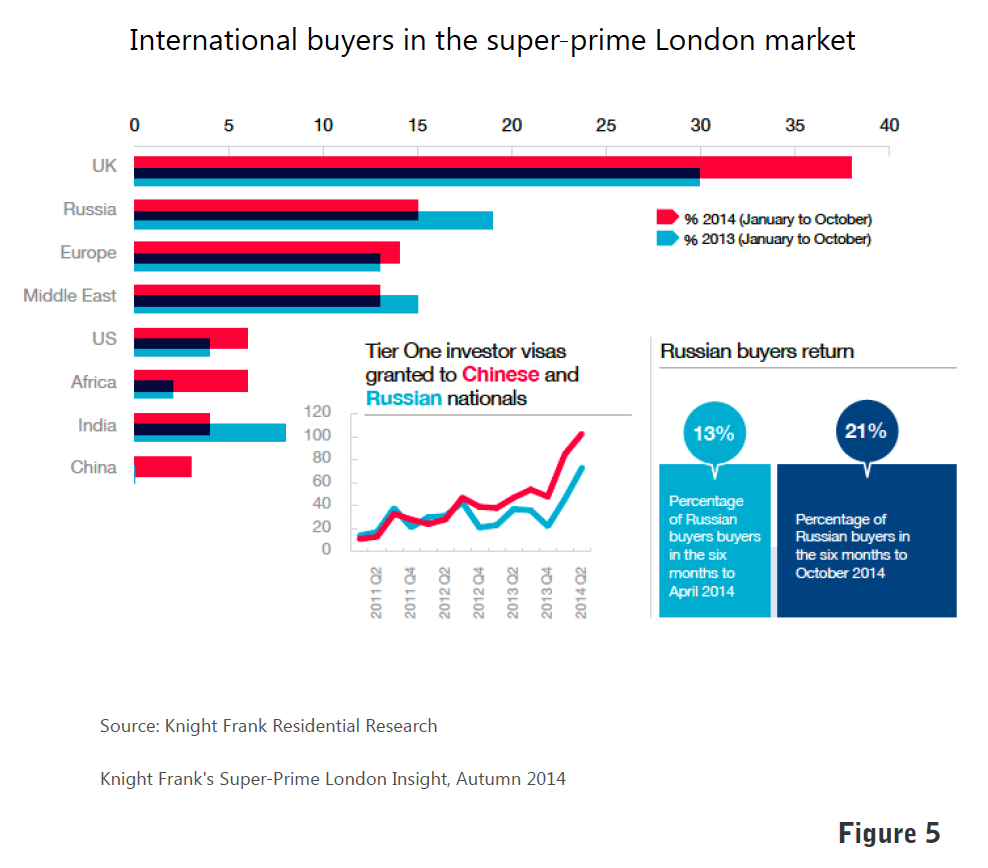
- Land Registry House Price Index, December 2014 – © Crown copyright 2014 Land Registry. © Crown copyright material is reproduced with the permission of Land Registry under delegated authority from the Controller of HMSO;
- Knight Frank’s Prime Central London Sales Index, August and December 2014;
- Knight Frank’s London Residential Review, Winter 2015;
- Knight Frank’s House Price Sentiment Index (HPSI), December 2014;
- Knight Frank’s Super-Prime London Insight, Autumn 2014.
Past issues
- Spring 2014
- Summer 2014
- Autumn 2014
- Winter 2015
- Spring 2015
- Autumn 2015
- Winter 2016
- Spring 2016
- Summer 2016
- Autumn 2016
- Winter 2017
- Spring 2017
- Summer 2017
- Autumn 2017
- Winter 2018
- Spring 2018
- Summer 2018
- Autumn 2018
- Winter 2019
- Spring 2019
- Summer 2019
- Autumn 2019
- Winter 2020
- Summer 2020
- Autumn 2022
- Winter 2023
- Spring 2023