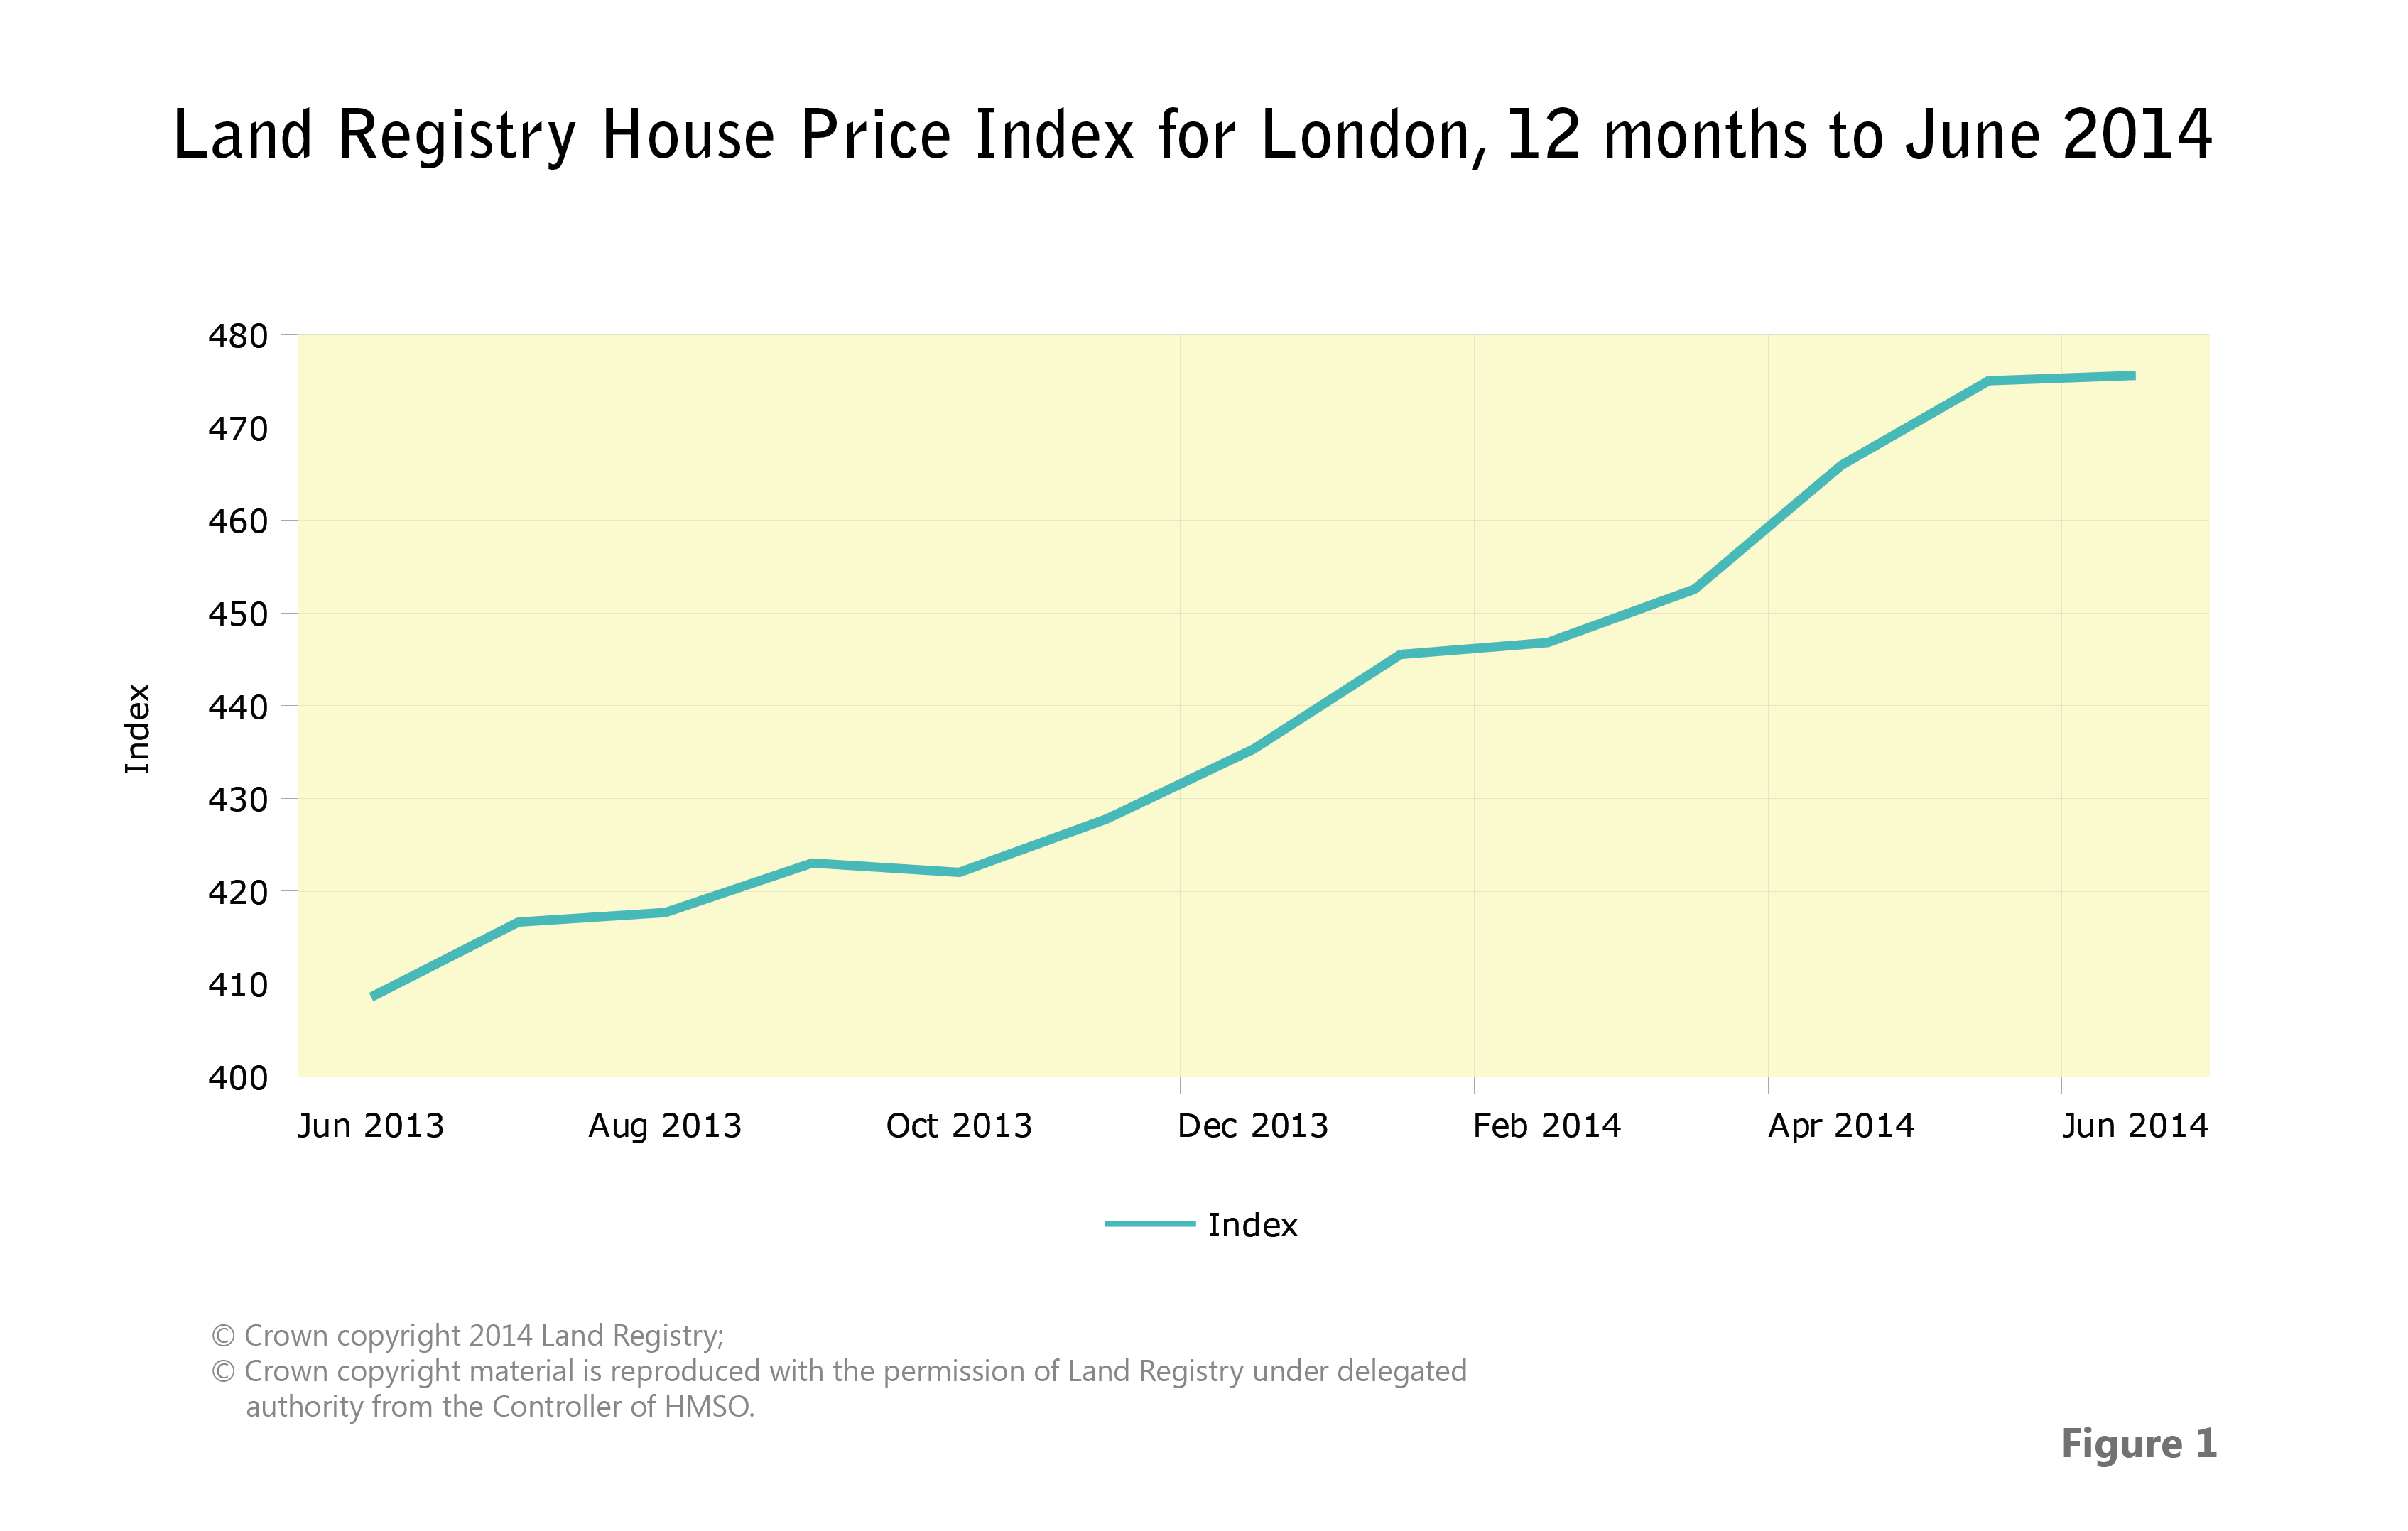
According to the Land Registry’s latest House Price Index (HPI), which captures actual changes in the value of residential properties, the price of property in England and Wales has increased by 6.4% in the last year. The region which experienced the greatest movement by far in its average property value over the last 12 months is London, with an increase of 16.4% (see figure 1). London property prices also saw the third largest monthly increase, at 0.1% between May and June 2014.
The two London boroughs with the highest average house prices by far remain Kensington and Chelsea, and City of Westminster. The annual increases in these boroughs were 15.1% and 17.8% respectively. However, some of the London boroughs with the highest annual increases in average prices were Lambeth (Nine Elms), Hackney, Southwark, Wandsworth, and Hammersmith and Fulham, which shows a tendency of investors to move to more up and coming areas. The annual increases in these boroughs were 26.8%, 25.5%, 23.0%, 21.8%, and 21.6% respectively.
The number of £1m+ properties sold in London in April 2014, increased by 35% on April 2013 figures. Comparing the number of sales for the same months in the £2m+ bracket, the increase was also significant at 28%.
 Although there is talk amongst central London agents about a slow down in price growth, according to Knight Frank, prime central London (PCL) prices saw their highest annual growth rate since February 2013, with an increase of 8.1% in June 2014. Prices increased 2.3% over the second quarter of 2014, compared to 1.9% during the first quarter. The monthly price increase for June was 0.8%, which has been the consistent rate for the last four months and puts growth back to December 2013 levels, after a dip in January and February 2014.
As shown in figure 2, the growth rates for the super high-end properties in the £10m+ bracket still remain positive, with an annual growth at 3.5% in June 2014, up slightly from 3.4% in February. In the £5m to £10m property bracket annual growth was higher at 4.9% and at the lower end of the bracket, annual growth rates for properties under £2m were 13.6% in June 2014, compared to 12.8% in February. 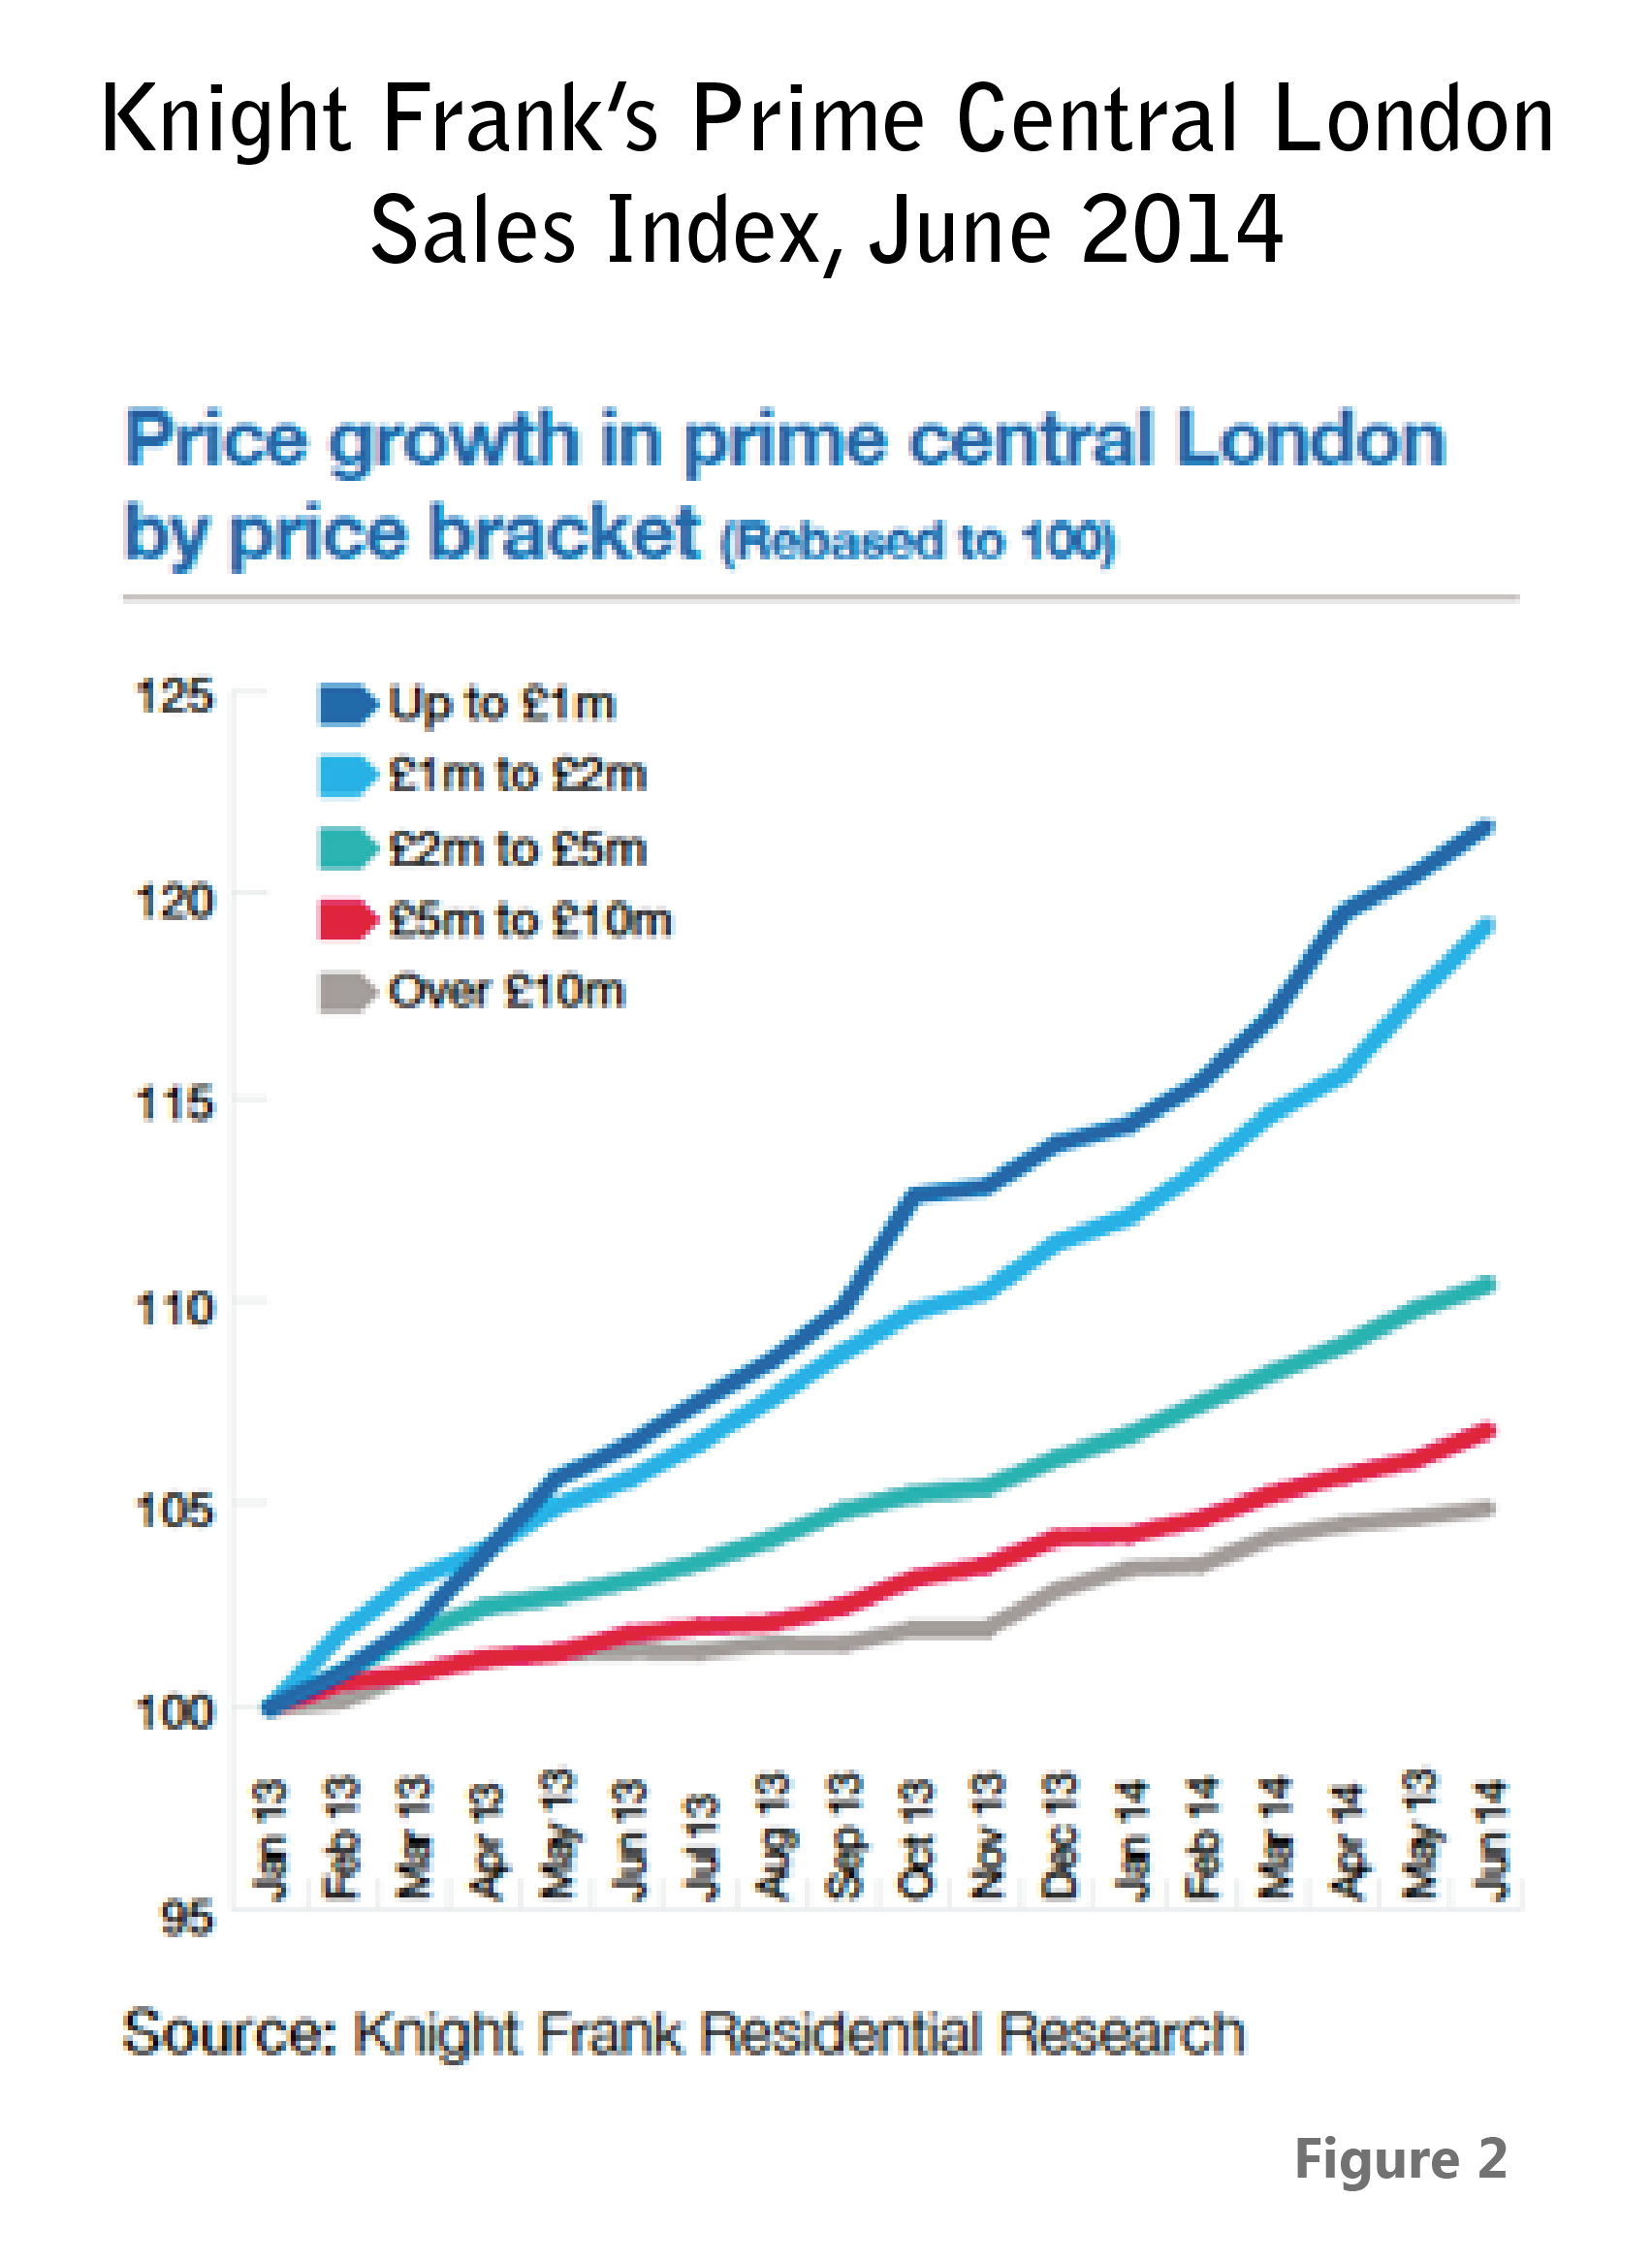
Knight Frank’s House Price Sentiment Index (HPSI), which measures households’ perceptions of current and future property values, saw the current HPSI value decline after its record high in May 2014, while the future HPSI fell to its lowest value in six months (see figure 3). However, for the 15th consecutive month the sentiment was that property values have continued to rise. Households across all 11 regions surveyed expressed a perception that their property values had risen in June, but at a slower rate than they had in May. Perceptions of price rises were strongest in London. Future expectations for London fell for a second time this June, after a new high in April. However, overall expectations are property prices will continue to rise further in 2014, but growth will be more moderate. We consider this a positive sign as it will help stabilise the market.
A significant percentage of PCL property buyers remain foreign. Investment is being driven both by international investors looking to escape rising economic and political instability in their own countries and by high-net-worth-individuals (HNWIs) simply looking to diversify their excess wealth. The former are mostly from South America, the Far East, and Russia, while the latter predominately hail from the Middle East, Italy, and China. They are spending more time in London for its world-class shopping, culture, and top restaurants, as well for the benefit of their children’s education at private schools.
The Chinese are increasingly purchasing properties for their own use and are currently testing the water with the majority of their investments below the £1m mark, but we anticipate they will be a future driving force in the market. However, due to the restrictions in capital outflows from China their investment will be paced, which is very good for the London market. Chinese developers are also on the increase in London.
- Land Registry House Price Index, June 2014 – © Crown copyright 2014 Land Registry. © Crown copyright material is reproduced with the permission of Land Registry under delegated authority from the Controller of HMSO;
- Knight Frank’s Prime Central London Sales Index, February 2014 and June 2014;
- Knight Frank’s House Price Sentiment Index (HPSI), June 2014.
Past issues
- Spring 2014
- Summer 2014
- Autumn 2014
- Winter 2015
- Spring 2015
- Autumn 2015
- Winter 2016
- Spring 2016
- Summer 2016
- Autumn 2016
- Winter 2017
- Spring 2017
- Summer 2017
- Autumn 2017
- Winter 2018
- Spring 2018
- Summer 2018
- Autumn 2018
- Winter 2019
- Spring 2019
- Summer 2019
- Autumn 2019
- Winter 2020
- Summer 2020
- Autumn 2022
- Winter 2023
- Spring 2023