According to the Land Registry, average London house prices rose to £514,097 in December 2015: 12.4% higher than 12 months earlier. London remains the strongest performing region across England and Wales, with its rate of price appreciation almost double the national average of 6.4%. The next best performing region is the East, where prices are rising at an annual rate of 10.6%.
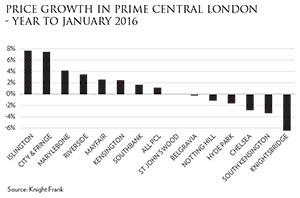 In prime central London, annual price growth in January 2016 was at 1.2% according to Knight Frank. The strongest growth was seen in markets outside of the core central London area, namely Islington (7.7%), City and Fringe (7.5%) and Marylebone (4.2%).
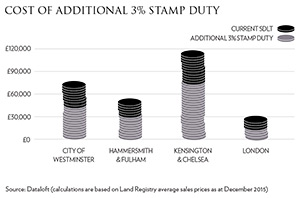
Demand levels were subdued over 2015 as a result of the increased costs of buying in the upper price bands. Along with extra taxes and costs, the increase in Sterling made properties less attractive to some overseas buyers. As a result, transaction levels were reduced, particularly in the upper price bands. Douglas and Gordon report a 64% reduction in the number of prime London sales over £2 million in the last nine months of 2015 compared to the same period in 2013.
 By the end of the year, Knight Frank reported that the stamp duty changes made in December 2014 were starting to be absorbed by the market. A growing number of vendors were prepared to set more realistic asking prices, as they acknowledged the lower rates of demand. However, the end of the year also saw a release in some of the pent-up demand that had built up over the year, with increased viewing figures.
Buyers in some areas have been hampered by a lack of available stock. In December, Home.co.uk reported a 17% decline in the level of available properties in London compared to a year earlier. This is a sharper decline than across England and Wales, where stock levels fell by 15%.
- Douglas and Gordon Emerging Prime Index, January 2016
- Home Index, December 2015
- Knight Frank PCL Sales Index, January 2016
- Land Registry House Price Index, December 2015 – © Crown copyright 2015 Land Registry. © Crown copyright material is reproduced with the permission of Land Registry under delegated authority from the Controller of HMSO.
- Your Move Buy to Let Index, December 2015
Past issues
- Spring 2014
- Summer 2014
- Autumn 2014
- Winter 2015
- Spring 2015
- Autumn 2015
- Winter 2016
- Spring 2016
- Summer 2016
- Autumn 2016
- Winter 2017
- Spring 2017
- Summer 2017
- Autumn 2017
- Winter 2018
- Spring 2018
- Summer 2018
- Autumn 2018
- Winter 2019
- Spring 2019
- Summer 2019
- Autumn 2019
- Winter 2020
- Summer 2020
- Autumn 2022
- Winter 2023
- Spring 2023