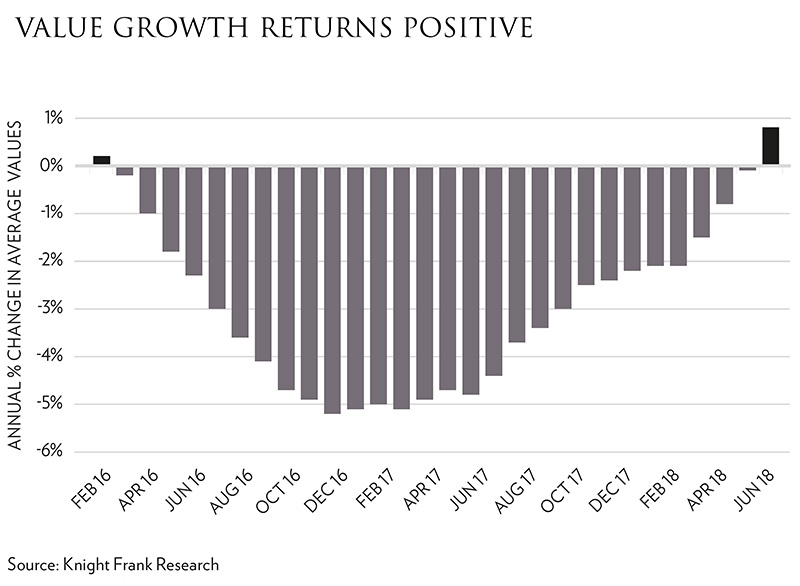
 Annual rental growth across London remained negative in June for the second successive month according to the official IPHRP* produced by the Office for National Statistics. Average rents are 0.2% below that of a year ago. However, across prime central London, Knight Frank report that annual rental growth has turned positive (0.8%) for the first time since January 2016.
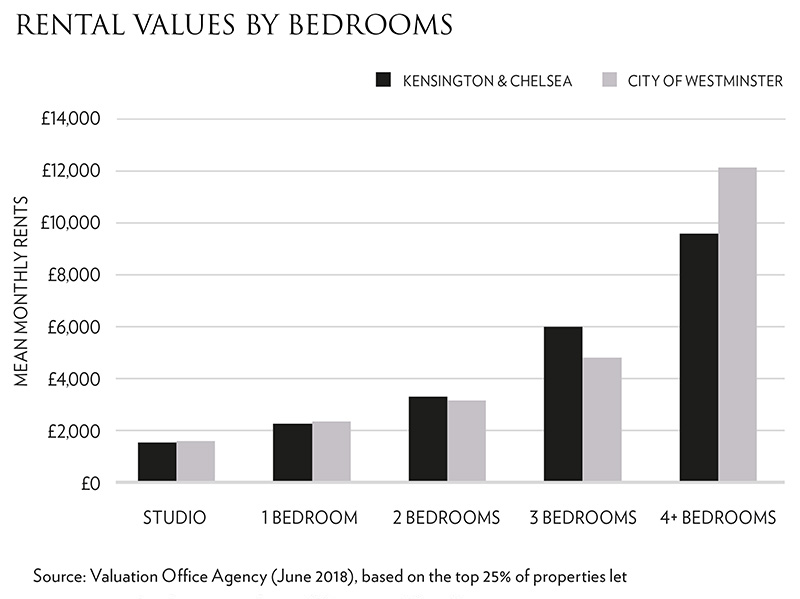
New data from the Valuation Office Agency indicates that mean monthly rents across the capital are almost twice that of England as a whole, £1605 versus £829, with nine of the top ten most expensive areas in which to live in England located across the capital. The prime residential boroughs of Kensington & Chelsea and the City of Westminster attract significant premiums, with rental values here for the top quartile (top 25% of properties) exceeding £3000 per month.
 Prices are steadying as supply levels have fallen and demand has risen. Across prime London new instructions in the first six months of 2018 were at their lowest level since 2011, and over 10% down on a year ago according to data from LonRes. The margins of the market have been the most affected, with new supply of rental properties for less than £1000 per week down by over 12% and new supply of properties over £5000 per week at its lowest level since 2014. Demand, however, has been on the rise. Knight Frank assert that the ratio between the number of new prospective tenants and the number of new lettings listings rose to 4.6 in May, the highest figure in more than ten years. However, it is unlikely that rental values will rise in any dramatic form. Results from the latest survey of chartered surveyors by RICS indicate that a net balance of agents expect rents to remain stable over the next three months.
* Index Private Housing Rental Prices
Past issues
- Spring 2014
- Summer 2014
- Autumn 2014
- Winter 2015
- Spring 2015
- Autumn 2015
- Winter 2016
- Spring 2016
- Summer 2016
- Autumn 2016
- Winter 2017
- Spring 2017
- Summer 2017
- Autumn 2017
- Winter 2018
- Spring 2018
- Summer 2018
- Autumn 2018
- Winter 2019
- Spring 2019
- Summer 2019
- Autumn 2019
- Winter 2020
- Summer 2020
- Autumn 2022
- Winter 2023
- Spring 2023