Annual price growth across London was 2.6% in August, with the average price of a property across the capital reaching £484,362 according to the UK House Price Index. Across prime central London Knight Frank report that prices fell by 4.6% in the year to September, the most modest annual fall since October 2016 and an improvement on -6.7% at the start of the year.
 The prime London market remains highly price sensitive due to the cloud of uncertainty posed by Brexit and the continued absorption of higher transactional costs. An analysis of LonRes data indicates that 84% of properties exchanged across prime London in the first nine months of the year experienced a price reduction, with asking prices lowered to equal or exceed the additional tax burden felt by prospective buyers. However, while buyers remain cautious, with the average time taken for a property to sell being 65 days in September, compared with 54 days a year ago (Rightmove), the market is far from dormant.
 Knight Frank and LonRes report that transaction levels between January and August were up 9.8% year-on-year. In addition, the number of new prospective buyers increased by 4.9% between January and September, compared to the same period last year, with the number of viewings up by 8.9%.
With few forced sellers, levels of available stock across the capital remain subdued. Stock levels per agent remain low, according to the RICS (September 2017), with new instructions across the capital for properties over £1 million down 18.2% year on year (Rightmove, Jan – Sept).
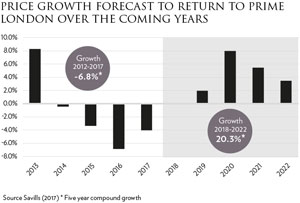
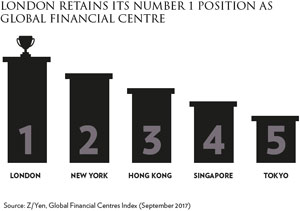
Despite the uncertainty, the capital continues to receive global accolades. It has extended its lead as the world’s leading financial centre in the most recent Z/Yen Global Financial Centres Index, the only EU city in the top ten, and is still considered a low-risk investment option for those looking longer term. Savills forecast that compound residential property price growth across the capital will be 20.3% by 2022.
Past issues
- Spring 2014
- Summer 2014
- Autumn 2014
- Winter 2015
- Spring 2015
- Autumn 2015
- Winter 2016
- Spring 2016
- Summer 2016
- Autumn 2016
- Winter 2017
- Spring 2017
- Summer 2017
- Autumn 2017
- Winter 2018
- Spring 2018
- Summer 2018
- Autumn 2018
- Winter 2019
- Spring 2019
- Summer 2019
- Autumn 2019
- Winter 2020
- Summer 2020
- Autumn 2022
- Winter 2023
- Spring 2023